'%20fill='%232E1091'/%3e%3c/svg%3e)
Why Demand Forecasts Break without Real-World Context

Share
'%3e%3cpath%20fill='%23ACA8BC'%20d='M13.714%2010.623%2020.416%203H18.83l-5.822%206.617L8.36%203H3l7.028%2010.008L3%2021h1.588l6.144-6.99L15.64%2021H21M5.16%204.171H7.6l11.227%2015.715h-2.44'/%3e%3c/g%3e%3cdefs%3e%3cclipPath%20id='clip0_1_4'%3e%3cpath%20fill='%23fff'%20d='M0%200h24v24H0z'/%3e%3c/clipPath%3e%3c/defs%3e%3c/svg%3e)
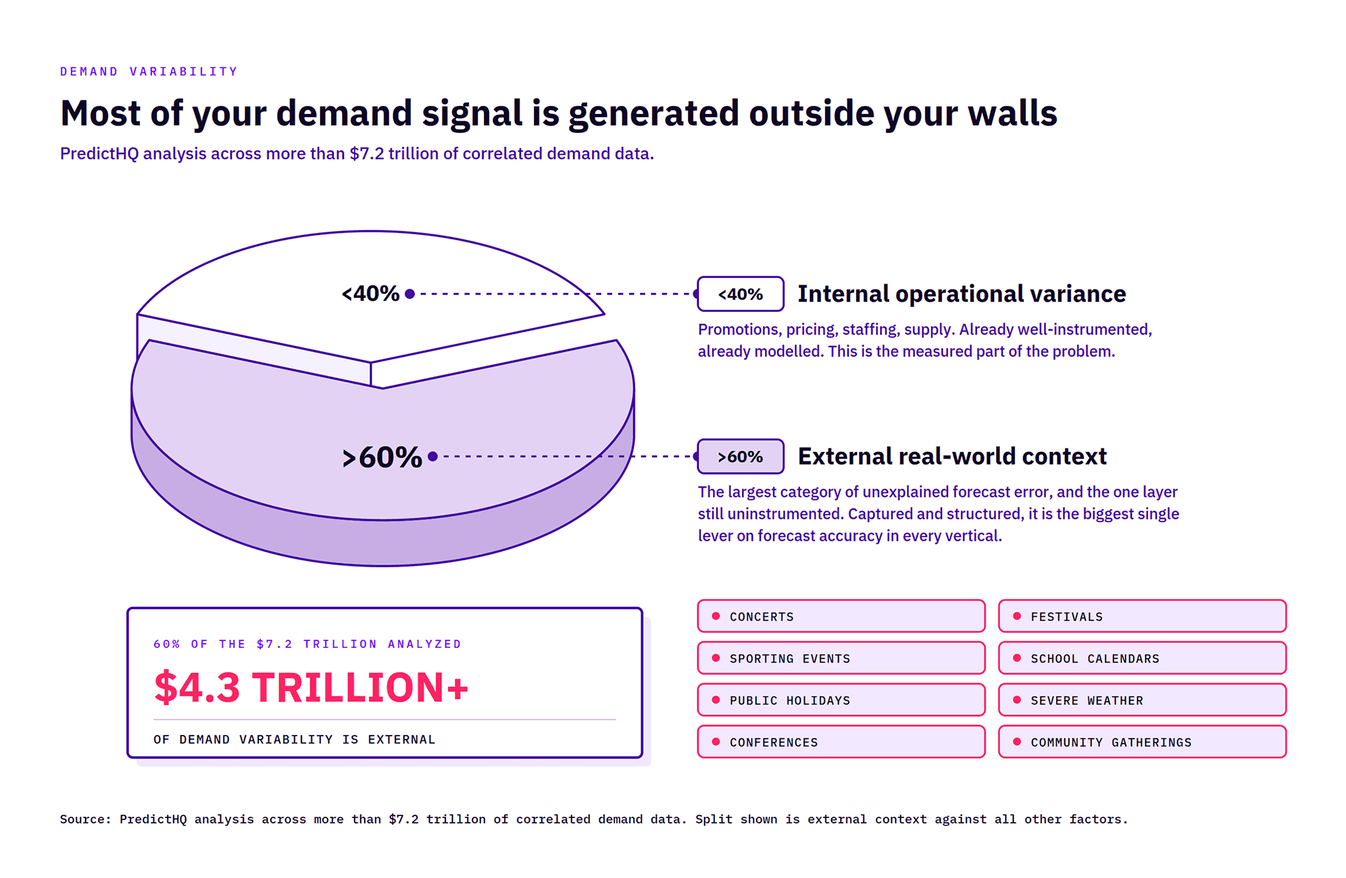
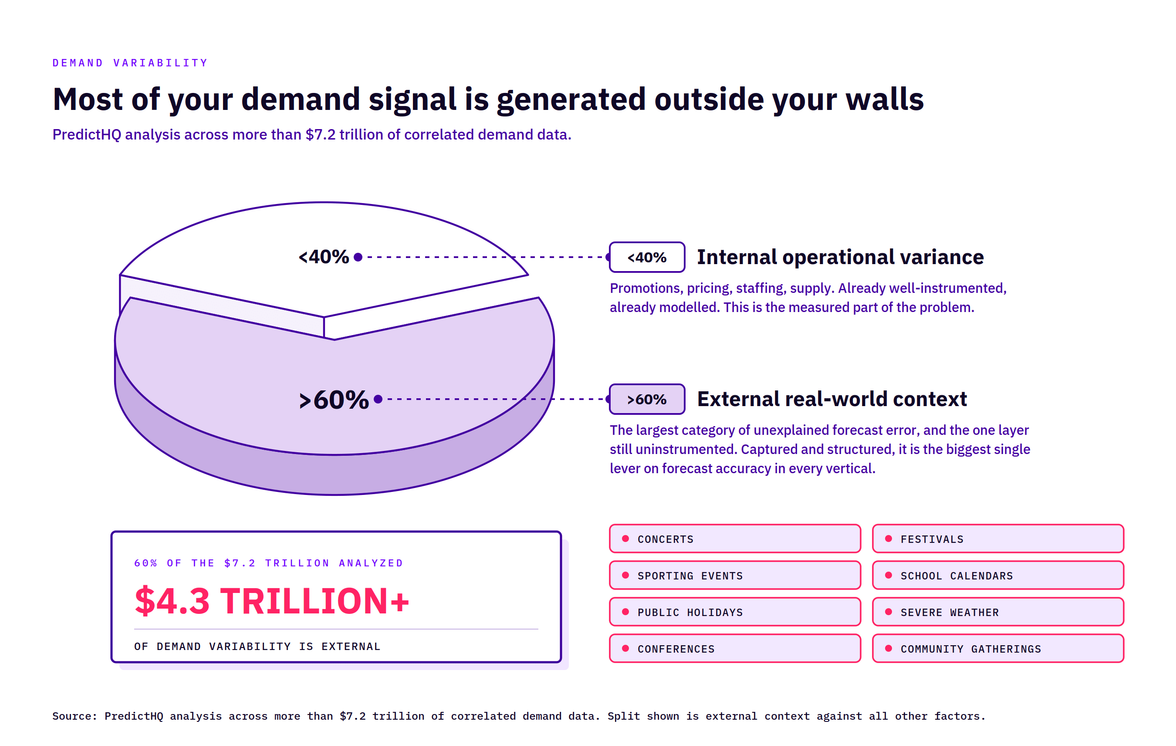
We analyzed $7.2 trillion of global demand data and found that 60% of demand variability is caused by real-world context. Now if you aren’t a data scientist, variability is just the fluctuation in demand. And real-world context is a phrase that represents the aggregate of the events happening around each of your locations. So the takeaway is this, since most of the variance you're trying to predict originates outside your business, no amount of internal data will fix it.
And you can see it in your own numbers. Pull up your model monitoring dashboards from last quarter and sort it by MAPE . The worst misses won't be spread evenly across the calendar. They'll cluster on a handful of days. The Thursday anime convention opened downtown, or the Saturday marathon re-routed half the city.
Those are also the days with the most revenue on the table. Forecast accuracy is highest when demand is ordinary and lowest when demand is exceptional. Your model gives you precision on the days that don't matter and guesswork on the days that do.
Most demand forecasting teams assume this is a modeling problem, and think a better model will solve their forecasting problems. However, models aren’t the only only reason why forecasting accuracy fails.
What does poor forecast accuracy cost QSR, retail, transport, and hotels?
Start with the size of the prize. IHL Group's most recent analysis puts the annual global cost of retail inventory distortion, meaning out-of-stocks and overstocks combined, at $1.73 trillion. Which, believe it or not, is roughly 6.5% of global retail sales.
The interesting number sits underneath the headline. IHL traces $148.8 billion of that total specifically to buying and planning failures. Which is a category that includes forecasting errors, seasonal miscalculations, and misread demand signals. That's the addressable slice.
This is literally the result of forecasts that were wrong about what customers would want and when. And the operator-level view is just as stark. New research from Starfleet Research found that only 18% of restaurant owners and operators feel very confident in their ability to forecast sales, labor needs, or guest traffic. Nearly a third say they aren't confident at all.
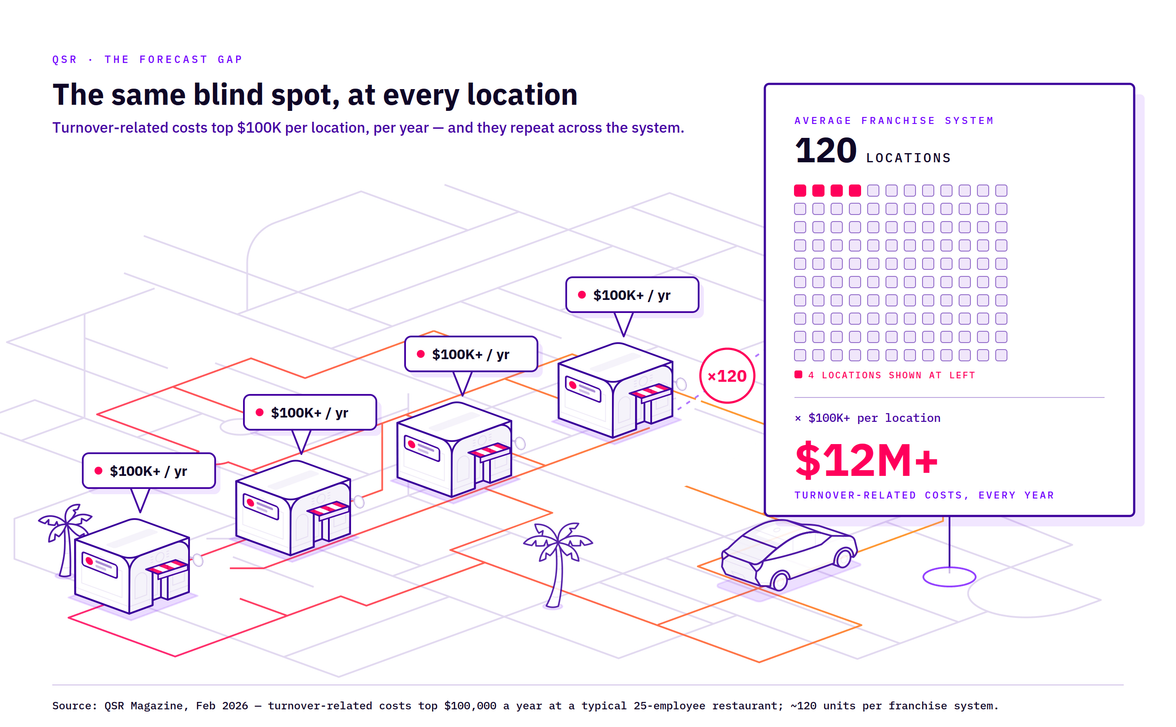
Those figures are pretty alarming considering how the restaurant industry has spent the last decade buying POS integrations, analytics dashboards, and scheduling software. Which basically means the technology arrived but the ROI is still stuck in transit. According to QSR Magazine, “for a typical 25-employee restaurant, this level of churn can translate into more than $100,000 in annual turnover-related costs.”
Retail and restaurants aren't alone in this. Hotels face the same problem from the opposite direction. It’s not that their forecasts have gotten worse, but that the buffer absorbing forecast error has disappeared. The American Hotel & Lodging Association found that 65% of surveyed hotels report staffing shortages, with 71% carrying open roles they couldn't fill despite active searches.
Labor is the main lever a property pulls when demand lands differently than planned. A fully-staffed hotel absorbs a bad forecast with overtime and redeployment. A hotel already running two-thirds short has nothing to absorb it with. So a miss that used to mean a slow check-in, now means closed outlets and walked guests.
Why do demand forecasts break on the days that matter most?
In a nutshell, the failure is structural. And it's easier to see once you describe what a conventional forecasting model is actually doing. A model trained on internal historical data learns three things well:
- your seasonal shape
- your day-of-week pattern
- and your long-run trend
That covers ordinary demand, which is why accuracy looks respectable in aggregate. What the model can’t learn from your own transaction history is anything about the outside world. It has no way to know that a sold-out concert with 20,000 people is booked 8 blocks from your flagship store next Tuesday. Or that a three-day medical conference starting this Thursday is filling 12,000 rooms within walking distance from your front door.
Those events don't appear in your data as causes. They appear as unexplained spikes, and only after the fact. So the model does what it was built to do. It treats them as variance. But the spike wasn't noise. It was a predictable consequence of a scheduled event that anyone could have known about weeks in advance.
This is what’s known as the context gap. Or in more simple terms, the disconnect between what a model knows (historical patterns), and what it needs to know (upcoming events).
Why doesn't more historical data improve forecast accuracy?
This is why most planning teams will be chasing their tail during the next budget cycle. Adding two more years of history gives the model more of exactly the thing that misled it. Even worse, it teaches the model to expect last year's surge on the same calendar date this year. Regardless of whether or not the event that caused it is happening again.
Recurring events move. Marathons shift a week. Conferences rotate cities. Festivals change venues, or lose a headliner and draw half the crowd. A model anchored to last year's dates will confidently overstaff for an event that isn't coming, then miss the one that is.
There's a second and much quieter problem we also need to address. Most enterprise forecasting pipelines include an outlier treatment step designed to stop extreme values from distorting the model. In practice, that step is where your event signal gets deleted. The days with the highest revenue at stake are systematically removed from the training set for being statistically inconvenient. The pipeline is working as designed and destroying the information you most need.
What actually improves forecast accuracy?
The fix is to give the model the causes, not just the effects. That means bringing external demand drivers into the model as structured, ranked, location-specific inputs alongside your internal history. Not as a spreadsheet that’s maintained on the side, but as ML-ready features that arrive in the same format and on the same cadence as every other model input.
Insights surface across the business to not only answer what happened, but also answer why. Which is the difference between a forecast that gets read and one that gets acted on. Gartner predicts that 70% of large organizations will adopt AI-based forecasting by 2030. They also identified touchless forecasting, meaning forecasting that runs without routine human intervention, as the scalable prize in demand planning. And touchless only works if the context arrives automatically.
The evidence on the payoff is measurable, if less dramatic than vendor marketing suggests. A 2024 systematic review of 119 studies found that machine learning models cut retail demand forecast error by 15–20% against traditional ARIMA baselines. With gradient-boosted models delivering an additional 8–10% accuracy gain in e-commerce forecasting.
One caution: more external data isn't automatically better. An NBA game has a completely different demand pattern for a downtown restaurant than for a suburban pharmacy three miles from the arena. What closes the gap is a relevancy layer that determines which external conditions have historically moved demand at each specific location.
Where should you start?
Start by evaluating the PredictHQ real-world context platform. Take demand history from one location with heavy event exposure, such as a store near a stadium, a hotel in a convention district, or a restaurant on a university campus, and upload it to Beam, our patented relevancy engine
Beam is PredictHQ's patented relevancy engine, and it answers the question your planning team can't answer by hand. Unlock which real-world conditions actually move demand at specific locations, and which ones are just noise. You'll have that answer in minutes rather than weeks. Export the findings as a report and send them straight to your stakeholders. Or you can copy the generated API code and drop the results into your forecasting stack.
Then run the comparison that builds your business case. Pull your 10 worst forecast misses of the last year, ranked by dollar impact, and check them against what Beam surfaces. In most organizations, 8 of the 10 have an answer that was publicly knowable weeks ahead. A game. A festival. A holiday weekend that shifted. That list is more persuasive than any vendor benchmark because it's built from your own losses.
You can run all of it on a free trial today, without talking to anyone.