'%20fill='%232E1091'/%3e%3c/svg%3e)
What 11.1 Million Days of Demand Processed Taught Us About Global Demand Volatility in 2025


Share
2025 was the year volatility became highly visible.
Across the customers whose demand data we processed to pinpoint the impact of events on their business, PredictHQ measured 28.26% average variability. A number that explains why even mature forecasting teams struggled with “unpredictable” demand. What appears random in a spreadsheet becomes legible when connected to the underlying events shaping real-world behavior.
This article unpacks the global trends, operational lessons, data-quality breakthroughs, and forecasting advances that defined 2025, expanding on the themes in our December newsletter.
The PredictHQ Demand Intelligence Pipeline: The Hidden Engine Behind Forecast Accuracy
Every analysis we ran this year, 38,281 of them across 165+ countries, flowed through a pipeline refined over a decade:
- Event ingestion
- Pulling from thousands of sources worldwide
- Cleaning, standardizing, and deduplicating
- Removing junk, merging duplicates, normalizing inconsistencies
- Spam filtering and credibility scoring
- Ensuring low-quality events never reach a model
- Correlation to real demand
- At scale, pinpointing what events impact businesses the most
- Real-world aware forecasting
- World-first event-driven models
This is the work most teams underestimate, and the reason they come to PredictHQ. The sophistication required to understand global events at scale is not something internal data teams can or want to maintain.
What We Learned Fusing Millions of Events With Billions in Demand Data
Volatility is the rule, not the exception
Few organizations quantify volatility across their entire network. When we aggregated volatility across customers, industries, and regions, the pattern was unmistakable: demand behaved wildly differently day to day, location to location, and events can help you make sense of it.
The most interesting stories came from overlapping events
Using Event Trends, we analyzed days where cities experienced multiple events with over 100,000 attendees. The compounding impact was dramatic and sometimes counterintuitive. Hotels, rideshare, parking, and restaurants all saw demand spikes that historical trendlines alone would never predict.
Your Predicted Impact Report: Turning Demand Volatility Into Revenue For You
Seeing global volatility at scale is powerful, but its real value appears when you understand how it affects your business.
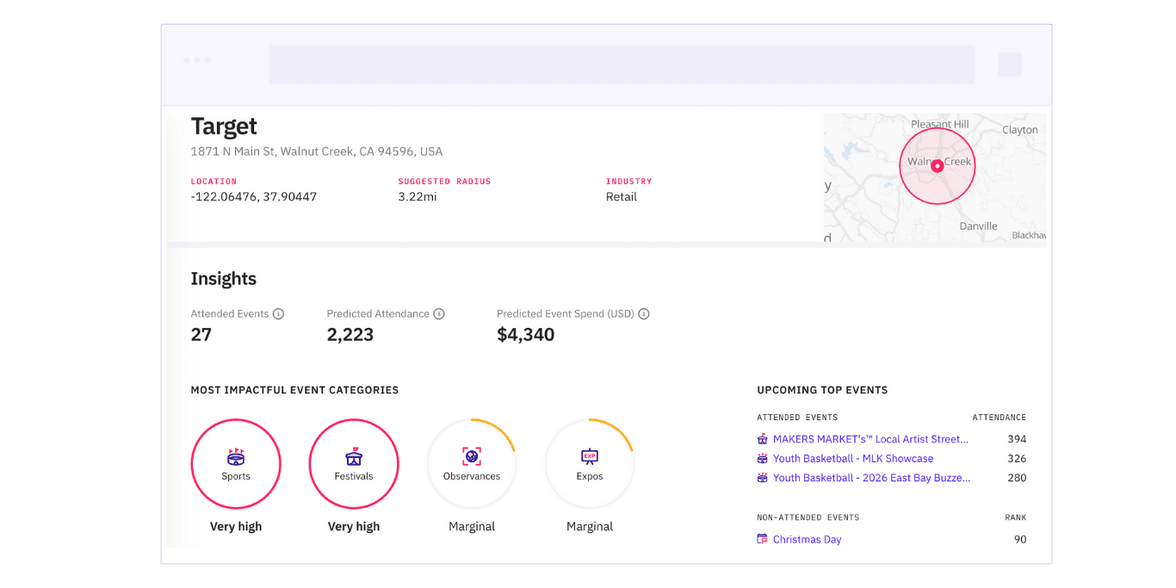
That’s why we introduced the free Predicted Impact Report. It’s a location-specific report that shows the events most likely to influence demand at a single site in the weeks and months ahead.
For teams evaluating PredictHQ, or customers looking to share how event-driven demand works with others, the report goes beyond showing what’s happening in the market. It identifies which events actually matter for that location, estimates how much they’re likely to affect demand, and highlights where action is needed.
If you operate across multiple locations, you can generate a Predicted Impact Report for each one, so every site gets a clear, location-specific view of upcoming event-driven demand changes.
Inside your report, you’ll find:
- The highest-impact upcoming events across your locations
- Expected demand shifts and attendance profiles
- Operational recommendations for staffing, inventory, pricing, or readiness
- A live forecast view that updates automatically as events change or move
Most businesses only track events they already know about. The Predicted Impact Report highlights the ones they don’t know about, and gives clear demand impact insights to turn demand volatility into advantage instead of surprise.
Data Quality: The Silent Driver of Forecast Reliability
Behind the scenes, we focused heavily on improving data quality because small errors at the event level create big problems in forecasts downstream.
What changed in 2025:
- Improved deduplication and spam filtering
- In sports alone, we identified major quality issues or duplication in 43% of ingested events and removed large volumes of invalid, misleading, or fake listings before they ever reached customer models. After quality controls, our measured error rate dropped to ~1.2% based on sample checks
- More accurate Predicted Attendance
- We significantly improved attendance predictions, especially for youth and women’s sporting events, where post-COVID behavior shifts had made historical assumptions unreliable. This matters because sports remain one of the largest demand drivers across retail, accommodation, and transportation
- Local Rank available across APIs
- Ensured event impact scales correctly across dense cities, suburbs, and rural areas using the same logic everywhere
- Faster, more stable polygon ingestion for Saved Locations
- Reduced noise and false positives caused by generic radii and mismatched geographies
When low-quality and duplicate events were removed before modeling, forecasts became more stable. Demand spikes that didn’t reflect real demand dropped, baselines stabilized, and the signals left behind lined up far more closely with what was actually happening.
Products That Meaningfully Moved the Needle
Event-Driven Forecasts
These automated forecasts became a turning point for many teams. Instead of spending months building pipelines and tuning models, customers could connect events directly to their demand and get a clear, adaptive forecast in minutes.
For one national retail chain customer, a 5% forecast accuracy lift translated to $275K in labor savings at a single location.
Saved Locations: Polygons Over Points
Demand doesn’t happen at a single latitude/longitude, and in 2025, our location model adapted. Polygon support allowed businesses to map true operational boundaries (e.g. irregular catchments, coastal shapes, dynamic service zones) and improve staffing, coverage, and planning.
The Future: Why Events Are Becoming the Primary Forecast Signal
Events don’t behave like historical trends. They move, evolve, and change their impact over time.
Take the American Society of Hematology (ASH) Annual Meeting & Exposition. It’s a recurring conference, but each year it shifts cities, draws different attendance patterns, and creates very different demand outcomes for hotels, transportation, and local businesses.
Because of that movement, past performance alone doesn’t tell you what to expect next. Recurring events aren’t predictable just because they happened before. Their location, scale, and timing change the outcome every time.
That’s why relying only on historical data falls short, and why visibility into upcoming events fundamentally changes how teams plan for demand.
What We’re Building for 2026
In 2026, our focus is on:
- Deliver accurate, explainable actions powered by our self-learning models, and Beam intelligence
- New patents supporting the verticalization of AI and the next evolution of foundational forecast models
- Features supporting deeper workflow integration within more forecasts, LLMs, and agents
If 2025 revealed the volatility, 2026 is about acting earlier and more confidently.
Final Thoughts
The world didn’t get less chaotic in 2025, but it became far more understandable. Across 38,281 analyses and $5.4 trillion in demand data, one truth stood out: volatility isn’t random, it’s event-driven. PredictHQ exists to make those drivers visible, so you can turn uncertainty into precision and revenue.
Here’s to 2026: acting earlier, with greater confidence.