Get Started
Contact our data science experts to find out the best solutions for your business. We'll get back to you within 1 business day.
Predicted Impact Area replaces one-size-fits-all polygons with a demand-calibrated boundary that is geography-aware, terrain-sensitive, and tuned to your industry.

Labor optimization: Ensuring the right number of drivers and store staff to meet demand.
Meeting the demands of customers and optimizing route delivery with anticipated disruptions.
Demand forecasting: Incorporating events into their Antuit-built models to better understand demand across 9600 stores.
Amazon Alexa's "Events Near Me" feature uses PredictHQ data to inform users about local events.
Demand forecasting: Getting drivers in the right place ahead of time to improve pick-up times.
Pricing: A key source of intelligence for the Lighthouse platform, enabling smarter pricing.
Your proximity to events and the impact these events will have varies by business and location. You want to identify impactful events specific to your business, which is hard when you're not sure exactly where to draw the line for your catchment area. A demand-calibrated boundary that stretches where roads flow freely, contracts around impassable terrain, and is tuned to how your industry attracts customers.
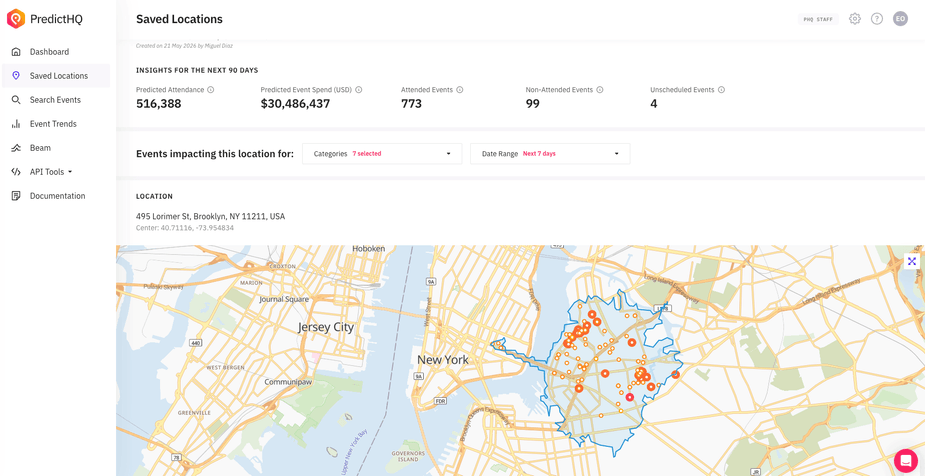
The Impact Area model combines real demand data, travel science, and geographic intelligence to generate a polygon that reflects how and where your customers actually come from.
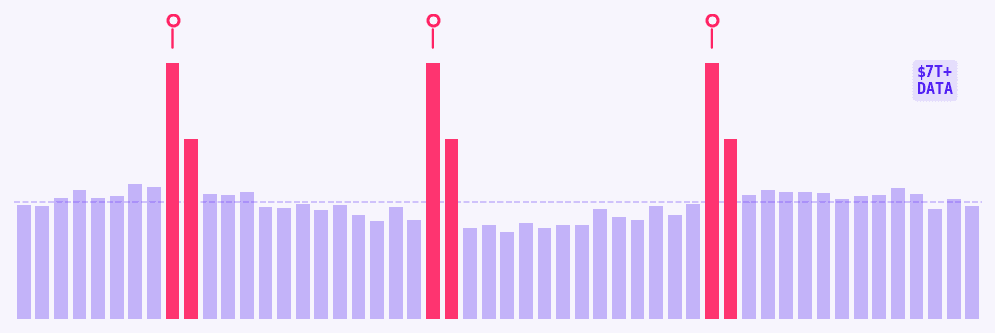


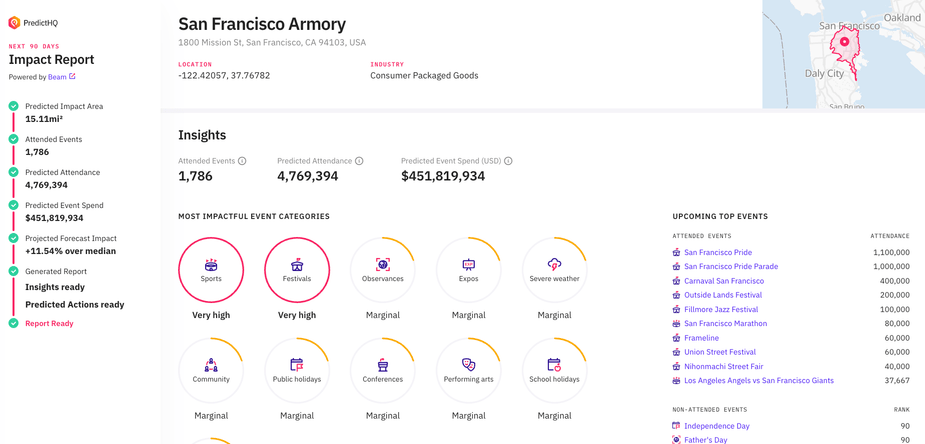
External events drive 60% of demand volatility. See Predicted Impact Area in action now with the Predicted Impact Report, you can instantly see which events are driving your demand, ranked by predicted impact. Enter a business or location to get a free, tailored report.

With PredictHQ the guesswork is gone, and we can clearly see where disruptions in delivery may arise, helping us deliver orders on time while cutting our manual research time by 50%.
Knowing the impact of incoming events will transform your business. RideLondon brings 280k people and $32 million to the city each year - and that's only one event.
Contact our data science experts to find out the best solutions for your business. We'll get back to you within 1 business day.
Demand forecasting: Getting drivers in the right place ahead of time to improve pick-up times.
Labor optimization: Ensuring the right number of drivers and store staff to meet demand.
Amazon Alexa's "Events Near Me" feature uses PredictHQ data to inform users about local events.