'%20fill='%232E1091'/%3e%3c/svg%3e)
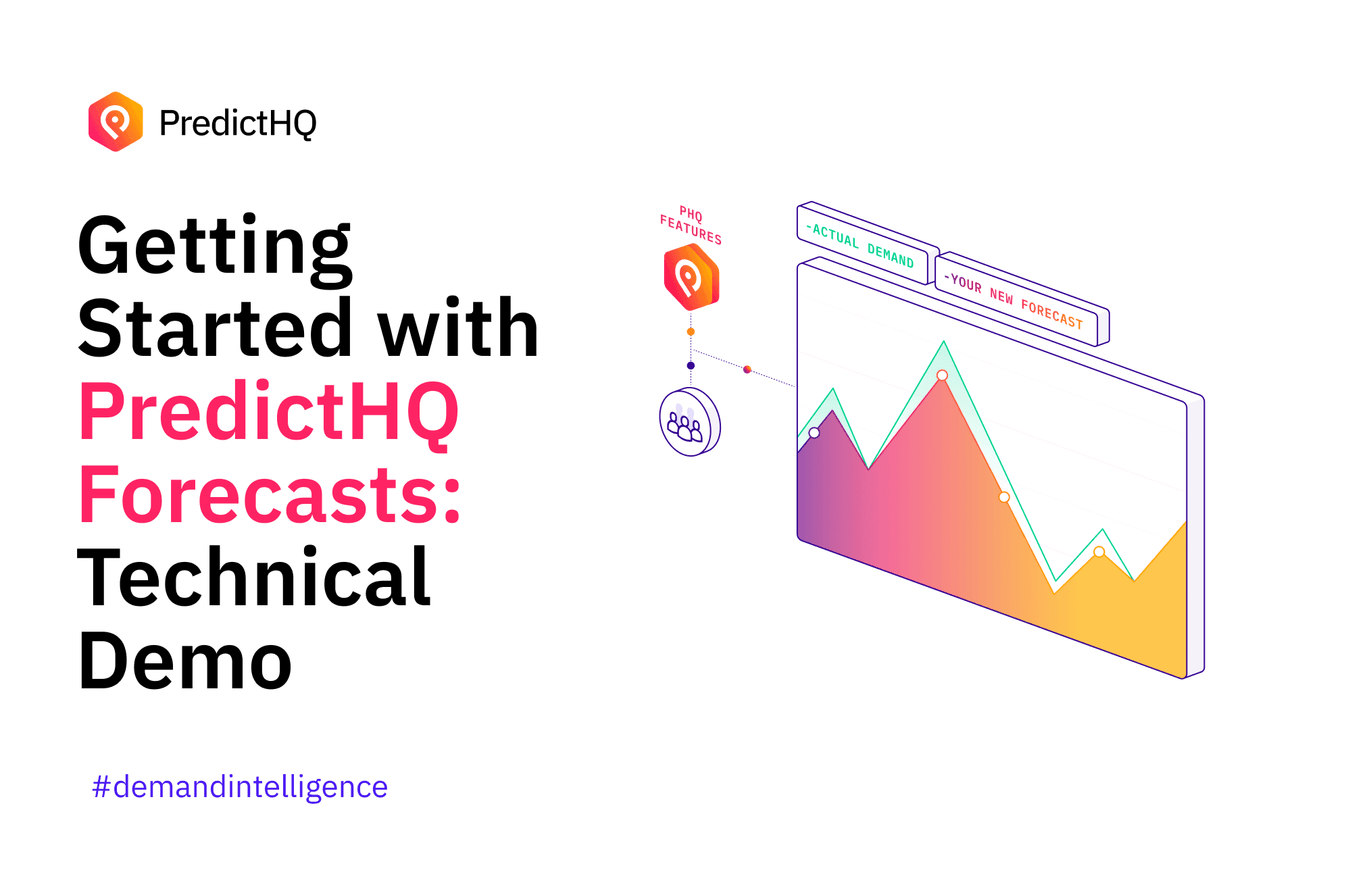
Get Started with PredictHQ Forecasts

Share
Want to get up and running fast with PredictHQ’s new Forecasts API?
The new Forecasts product from PredictHQ delivers accurate, event-aware business forecasts in a fraction of the time and cost of traditional forecasting methods.
Watch the video below from PredictHQ Sr. Data Scientist Tania, who will be walking through the sample notebook available in our documentation here.
Ready to get started?
- Activate your free trial to build your first event-driven Forecasts today.
Transcript:
Hi, I'm Tania, a Senior Data Scientist here at PredictHQ. In this video, I'll be showing you how to use the Forecast API.
The Forecast API is designed to improve forecast accuracy with fast, accurate, and easy-to-run forecasts, and at a fraction of the cost of building your own model. It's the only fully-automated, event-driven forecasting solution on the market, helping you see results quickly.
Powered by Beam, the Forecast API works alongside our Features API, which provides high-quality, forecast-ready features. If you want speed and simplicity, start with the Forecast API. For more control and flexibility, use the Features API. Together, they help you forecast demand more accurately, so you can make smarter decisions. around staffing, inventory, and other critical operations.
You can use the Forecast API anywhere, on any platform. For this demo, we'll use Amazon SageMaker. This notebook will show us how to create a model, retrieve evaluation metrics, as well as generate forecasts for the next seven days.
Let's start off by importing our libraries and loading our access token. The first step that we'll have to take is to create a Saved Location for our forecast.
In this example, we'll be looking at a restaurant location somewhere in London. Next, we'll calculate a suggested radius. This is the ideal radius around the location where events are likely to impact the business. With this information, we can now create the save location. Using this location ID, we can now create our model.
And next, we'll be able to upload our demand data. While that's taking place, let me just show you what the demand data looks like. We have a column for date, as well as a column for demand. In this case, the demand is sales.
Now, let's trigger the model. This may take up to a few minutes, so for the rest of the notebook, let's continue with this model ID, which I created earlier. We can get evaluation metrics for it. There are some common data evaluation metrics provided here, for example, the mean absolute percentage which in this case is 9.28%. Obviously, you can use these evaluation metrics to evaluate the performance of the model, as well as comparing with other models, or any benchmarks that you might have.
Lastly, let's generate our forecasts. We can visualize them in this time series chart; the historical data which we provided to train the model with in the blue, as well as the future forecasts in red.
If you found any of this interesting, would like to improve the demand forecasting for your business, or if you have any questions whatsoever, please contact us and we'll be happy to help.
Thank you.
- End of transcript.
💡 Sign Up - Forecasts API: Create an account to start using Forecasts now Sign up