'%20fill='%232E1091'/%3e%3c/svg%3e)
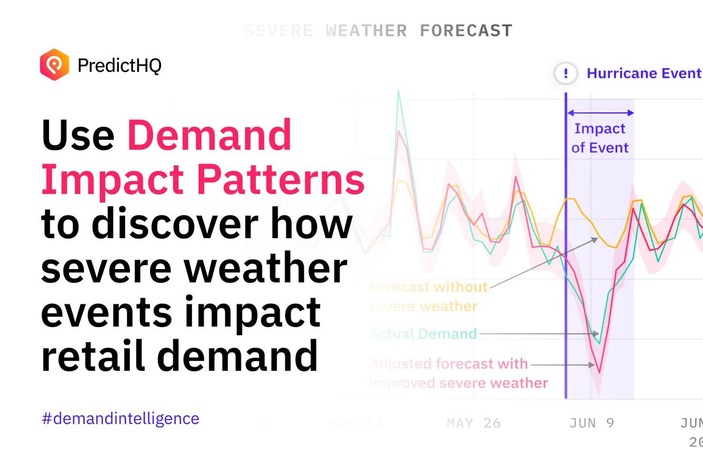
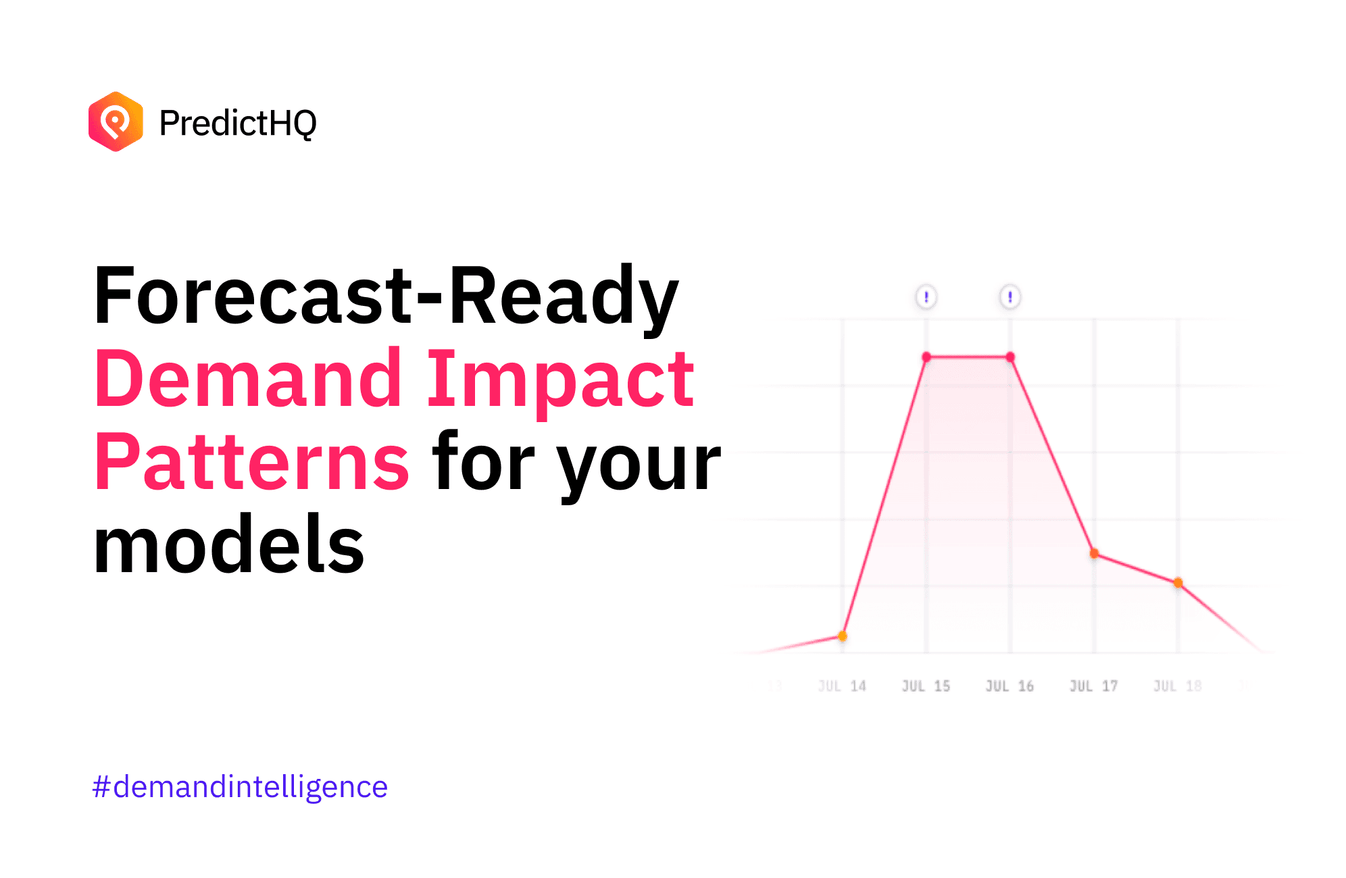
Forecast-ready Predicted Impact Patterns for your models

Share
Indicate the impact leading up to and after severe weather events
Forecasting models need to know exactly how long unplanned severe weather events will have an impact, and how severe that impact will be on each day. That’s why we created Predicted Impact Patterns, the generalized impact pattern of 73 kinds of severe weather events to inform machine learning models about the true impact of an event.
These patterns make it easy for you to identify the impact on demand on the days leading up to, during, and after severe weather events. You can now access Predicted Impact Patterns through the API, meaning you can easily integrate them to update your forecasting models as soon as reliable weather data is available.
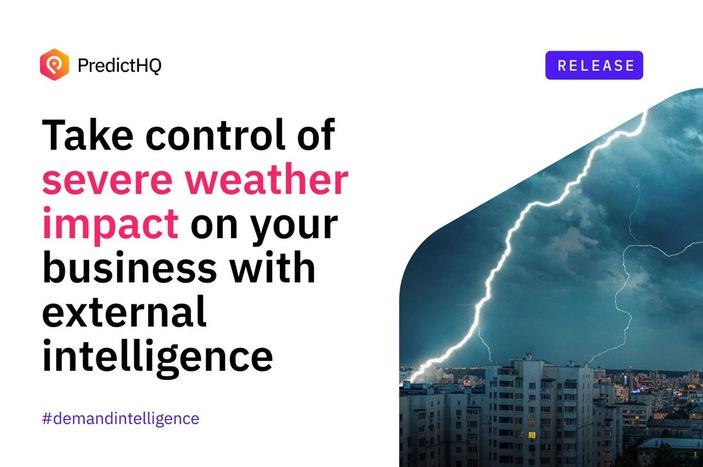
For severe weather, impact isn’t a one-time thing
Severe weather events such as hurricanes and floods move across different locations and change in intensity throughout their duration– making it difficult to accurately determine their impact on demand in advance or as they occur. Yet they’re increasingly common, and can significantly disrupt demand forecasting and profitability.
Understanding the role of severe weather is a key intelligence source in identifying why 58% of retail stores experience significant over- or under-forecasting due to severe weather events based on our findings. Now, you can fix this problem for good by integrating Predicted Impact Patterns directly into your models.
This gives you the foresight to:
- Ensure appropriate safety plans for impacted store locations
- Match staffing and inventory to predicted impact
- Redirect inventory likely to go to waste to stores that won’t be impacted
💡 Read the technical document: Discover the true impact of severe weather events Learn more in docs
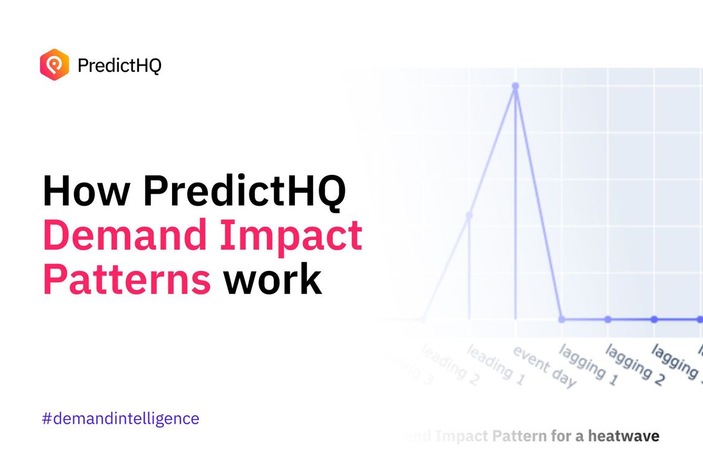
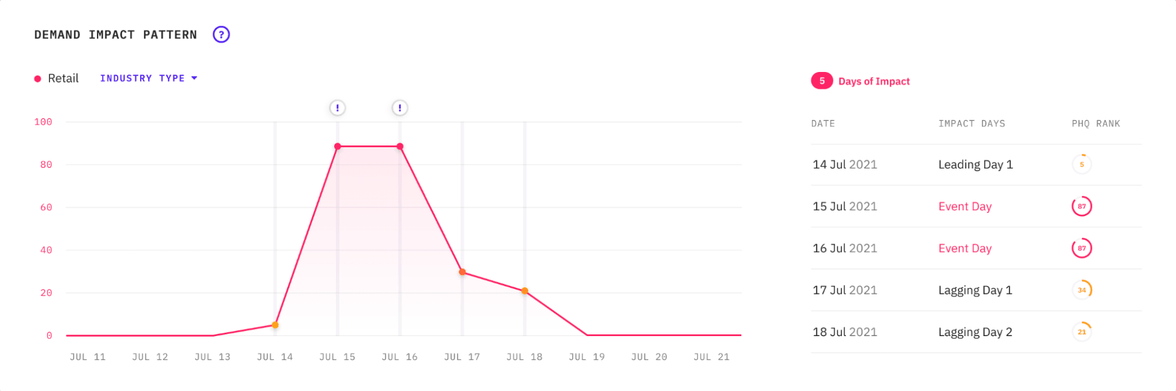
For example, take the demand impact pattern graph below for a hurricane. As you can see in the graph, once the event occurred on July 15, if a team didn't take into account the total demand impact from this hurricane, they would have already missed out on the rising build up of demand that began the day before, or they may have over-forecasted for the days following the event.
Predicted Impact Patterns in the API - the technical details
Predicted Impact Pattern is a new field in our API response which is present for events that have a demand impact pattern. Predicted Impact Pattern is present in the impact_patterns field in the API.
Let’s have a look at an example. Below is a severe weather event for the US. It’s a flood event in Washington State in the US for the Chehalis River area. The original flood warning stated “At 142.5 feet, the Chehalis River in Thurston County will flood several roads in Independence Valley with swiftly moving water including SR-12 and James, Independence, Moon and Anderson Roads. Flood waters will cut off access to and from Chehalis Reservation and inundate nearby farm lands. Some residential structures may be threatened.”
Below is an example curl call to get back this event:
curl -X GET https://api.predicthq.com/v1/events?category=severe-weather&id=3ZiJbYiRw7srLu5yBg \
 -H "Accept: application/json" \
 -H "Authorization: Bearer $ACCESS_TOKEN"
Let’s look at impact_patterns field in the response shown below:
...
id": "3ZiJbYiRw7srLu5yBg",
...
"impact_patterns": [ {
"vertical": "retail",
"impact_type": "phq_rank",
"impacts": [
{ "date_local": "2022-01-07",
"value": 17,
"position": "leading" },
{ "date_local": "2022-01-08",
"value": 41,
"position": "leading" },
{ "date_local": "2022-01-09",
"value": 86,
"position": "event_day" },
{ "date_local": "2022-01-10",
"value": 33,
"position": "lagging" },
{ "date_local": "2022-01-11",
"value": 16,
"position": "lagging" } ]
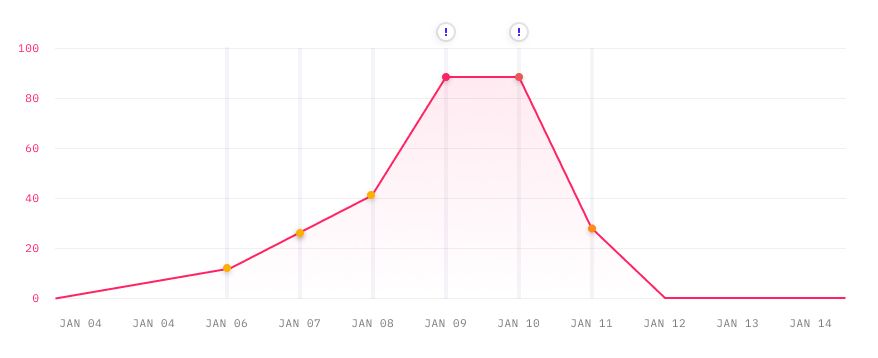
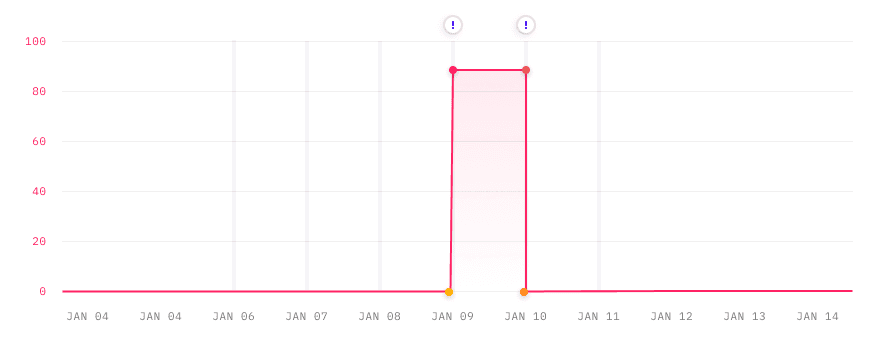
}As shown in the Predicted Impact Pattern graph below, the flood event itself runs from January 9 to January 10, but there are leading and lagging days of impact before and after the event. One day prior to the event, there’s an impact rank of 41 which indicates a significant level of demand.
Without Predicted Impact Patterns, the same results would be lacking these crucial details, only displaying the impact on the days of the event itself:
In this example, stores in Washington state cities including Rochester, Oakville, and Grand Mound can all be impacted by this flooding. Being able to see the impact on the days before and after the event means your forecasting models can take into account the true impact of the event, and adjust demand up or down before and after the event occurs.
Predicted Impact Patterns are currently released for severe weather events. In future we will be extending it to more categories. See our severe weather data science guides for a guide to using demand impact patterns in demand forecasting.
💡 Severe weather data science guides: Explore how to integrate Predicted Impact Patterns today Learn More in Docs