'%20fill='%232E1091'/%3e%3c/svg%3e)
Understand how people watching boxing, golf, tennis and more on TV impacts your demand


Share
Note: This article hasn't been updated for a while and may contain outdated content. View our full list for more recent articles.
Our world first Live TV Events feature allows you to accurately forecast how many people will watch a sports game down to the county level. We started with major US team sports including Football (NFL), Basketball (NBA), Baseball (MLB), Soccer (MLS), and Ice Hockey (NHL). Our newly released Top Viewership sports extends this coverage to a lot more sports!
Here are some of the key sports events we’ve added coverage for:
- NCAA Men’s Baseball
- NCAA Women’s Basketball
- NCAA Women’s Softball
- Horse Racing including the Belmont Stakes, Kentucky Derby, and Preakness Stakes
- Auto Racing including IndyCar and NASCAR
- Soccer including CONCACAF Champion League and the CONCACAF Gold Cup
- Boxing
- Copa America (Soccer)
- FIFA World Cup (Soccer)
- UEFA Champions League (Soccer)
- Masters Golf
- PGA Championship and the PGA Tour
- UFC
- US Open (Tennis)
- Wimbledon (Tennis)
For this release we focused on the most watched sports in the US we didn’t already cover. We already support NFL and that’s right up there in terms of the most watched sports broadcasts. We prioritzed sports events that are nationally broadcast and selected some of the most watched sports to add to our Live TV Events feature.
This release increases the depth and coverage of our intelligent event data. So, now with additional coverage for Motorsports you could see that around 208,000 people watched the 2019 Indianapolis 500 in Marion County, Indiana. Or that around 45,000 people in Cook County, Illinois watched Vasiliy Lomachenko vs. Teofimo Lopez in 2020. Or that around 25,000 people watched the Wimbledon Championships Men’s final in Alameda County, California in 2019. And so on.
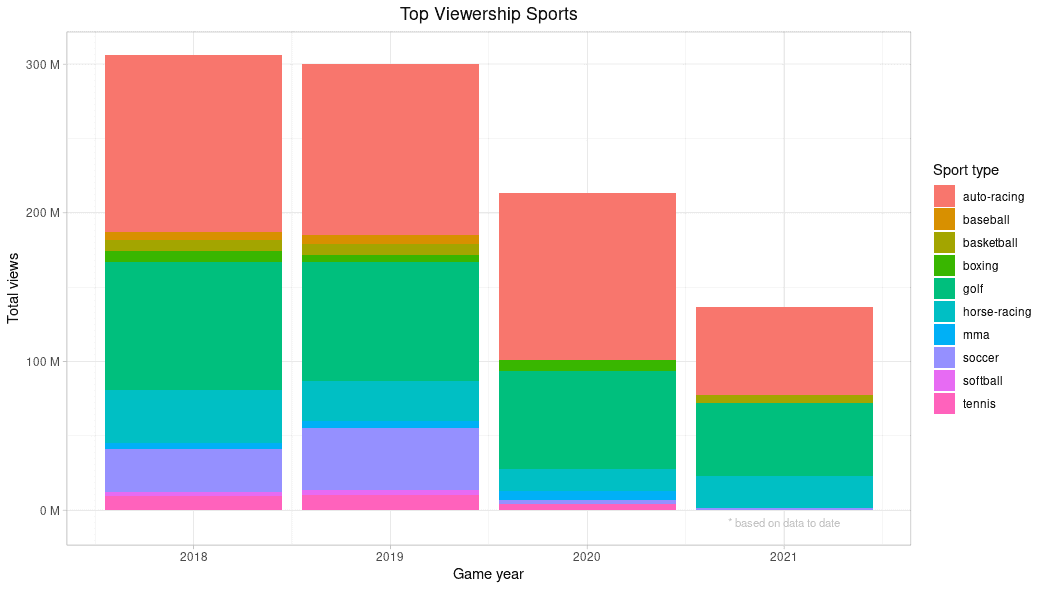
The graph below shows the total number of views for some of the new sports that we’ve added to Live TV Events for the last few years:
The Live TV Events feature enables our customers to forecast the demand caused by people watching sports games on TV. For example, we know people often order food or drinks to watch the big game with most American families spending more than $30 on food and drinks to enjoy during a standard game. For quick service restaurants and delivery apps, knowing about sports games that impact demand enables them to prepare properly. The Live TV Events feature provides forecast ready and forecast grade data for companies to use in their demand forecasting solutions to more accurately calibrate their inventory, staffing, and delivery strategies.
Our broadcast API returns TV viewership per county with both two years historical data and future viewership for the next two weeks. Use our data science guides to get started with using Live TV Events in your forecast.
The addition of these sports allows you to even more accurately capture the demand generated by people watching these games on TV. This is especially useful for quick-service restaurants, food delivery services, or other businesses where demand is impacted by what people are watching on TV.
To see these sports in our WebApp you can search on labels like boxing, MMA, golf and tennis. You can filter on labels in the broadcast API or use the labels fields to see the type of sport returned. Sign up and try out TV events today with our free trial!