'%20fill='%232E1091'/%3e%3c/svg%3e)
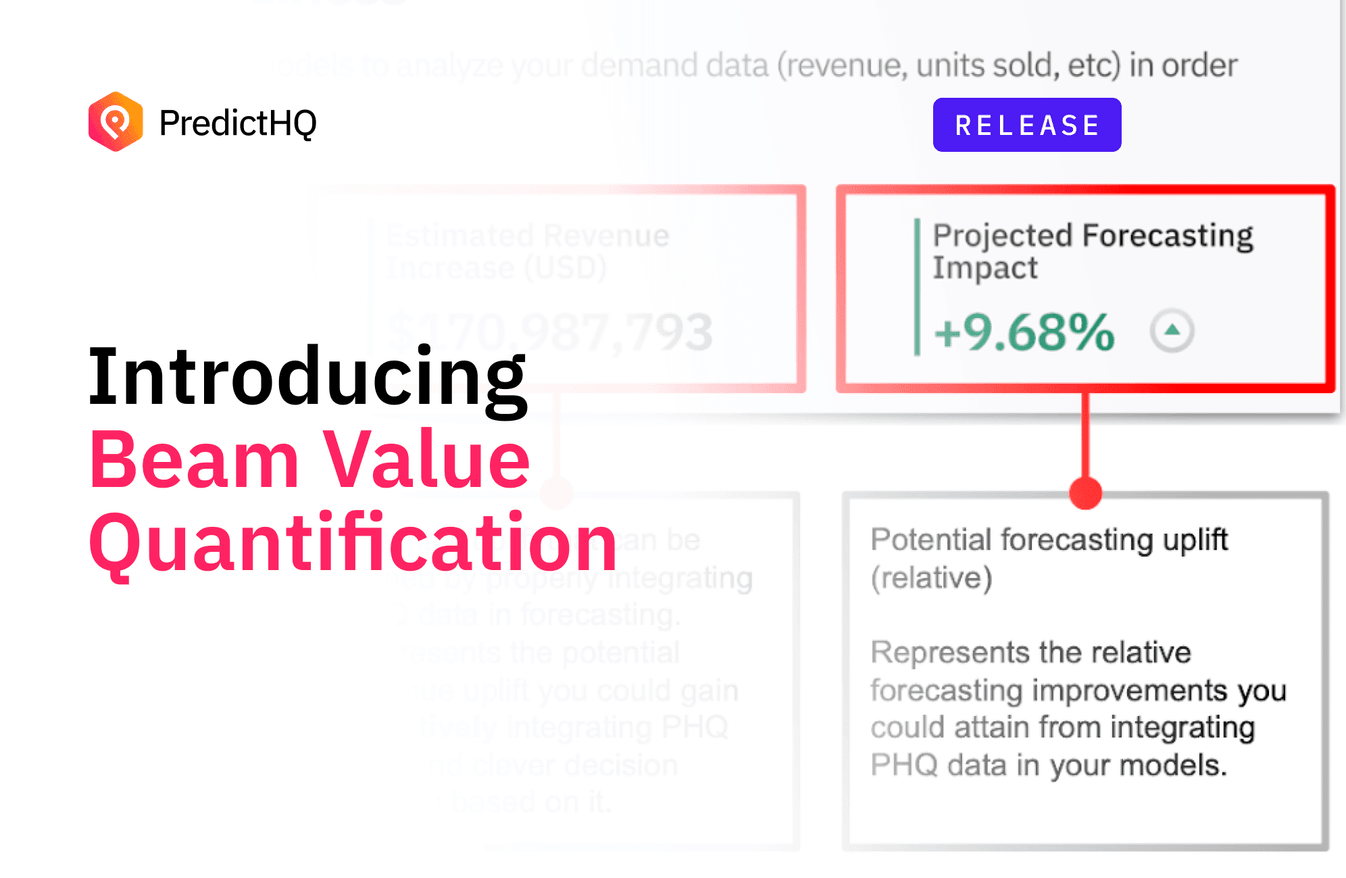
Introducing Beam Value Quantification
Share
What is the revenue uplift potential driven by events? A question we get asked far too often. Introducing Beam Value Quant, the newest update to Beam. As a refresher, Beam is our automated relevancy engine that accurately reveals the events that drive demand for your business.
Beam identifies the events that have impacted your demand in the past, to help you make better decisions in the future. The tool converts unstructured, dynamic event data into a workable dataset, allowing data science teams to use intelligent event data in machine learning models.
Beam Value Quantification is now a part of your Beam Report, powered by advanced machine learning models that analyze your demand data (revenue, items sold, etc.) to correlate the impact of events and attribute a financial impact to them. Beam Value Quant predicts how events will impact your business by looking at the abnormal fluctuations in your demand, then predicting the impact of events that are happening on those given days.
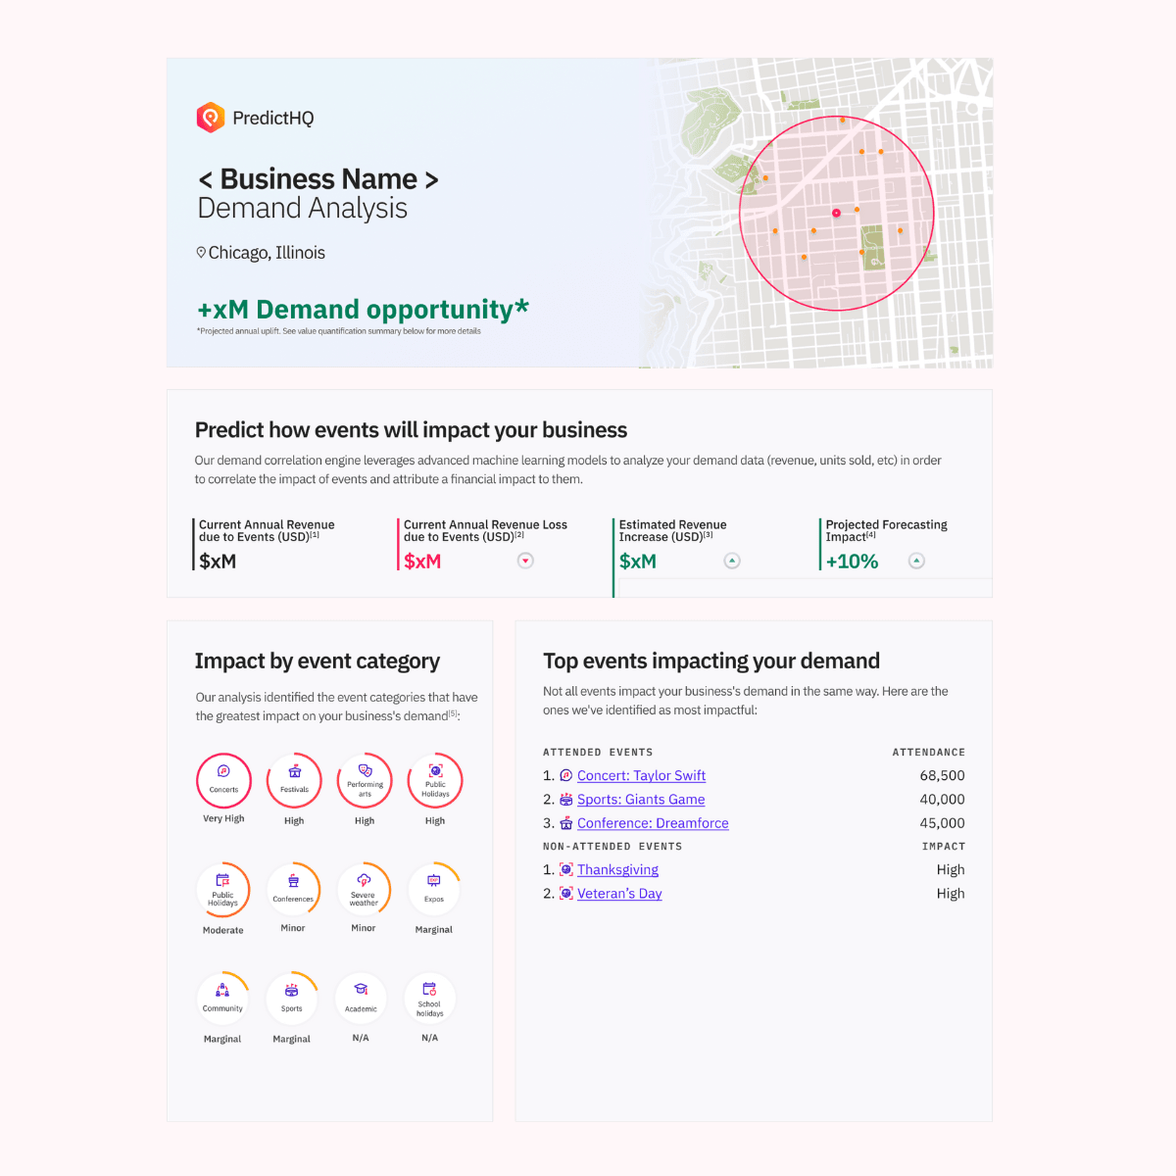
In the screenshot below is an example of a Beam Report PDF detailing demand levels for a group of business locations. The Value Quantification part is where it says “Predict how events will impact your business”, and includes key figures such as the businesses’ current annual revenue gained and lost due to events, as well as the estimated revenue lift the business can expect to see by integrating predictive demand intelligence into their forecasting models.
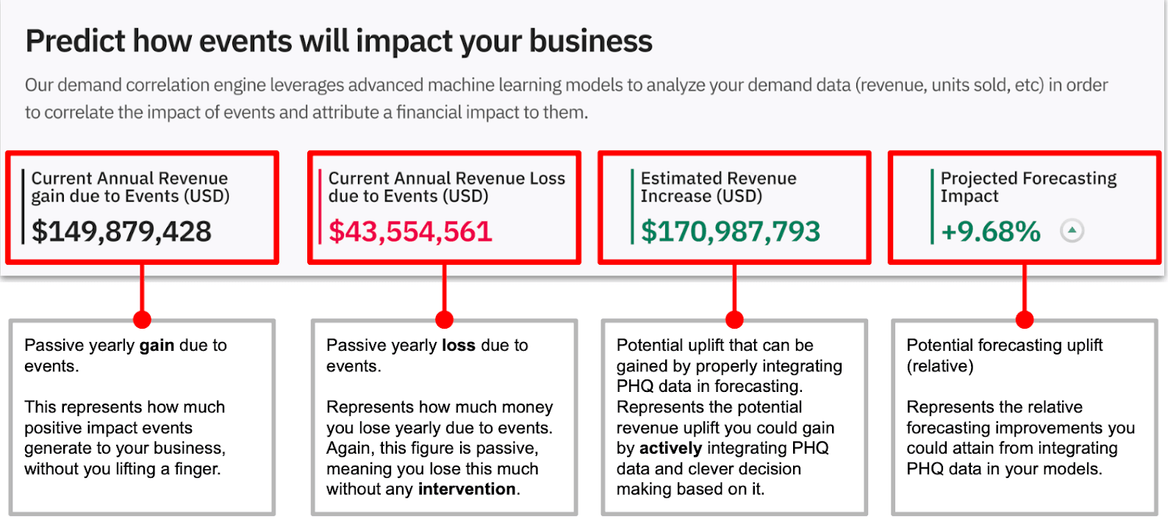
In this case, these locations can expect to see an additional $170,987,793 in combined earnings annually by increasing their demand forecasting accuracy with PredictHQ’s intelligent event data – representing a projected forecasting impact of 9.68%.
Get your comprehensive Beam report
Beam now provides you with a report with key insights into how events will impact your business including forecasted revenue uplift, improved forecast accuracy, and key event impact metrics – so you can get right to the insights that matter most. This report also highlights top events driving demand around your locations, making it simple to connect the dots between events and financial outcomes. Here’s an overview of what the report includes:
- Category Importance: Identify what drives demand within your industry.
- Correlation Charts: See how key factors interrelate over time.
- Future and Historical Predictions: Evaluate both past and upcoming events that impact demand.
- Predicted Relevance: Understand how future events are likely to affect your business.
- Code Export: Ready to use our features in your own forecasting models? Copy the API-ready code and get started instantly.
Make your forecasting real-world aware
Ready to better understand and control demand variability with Beam Value Quant? Jump into Beam today and see how our latest update sharpens your forecasts and improves your decision-making power.
💡 Get Started: Reveal the financial impact of real-world events Beam