'%20fill='%232E1091'/%3e%3c/svg%3e)
Enhancing Demand Forecasting with PredictHQ and PowerBI: A Technical Exploration

Share
Introduction
In today's fast-paced world, where data science and artificial intelligence are rapidly transforming business operations, mastering demand forecasting has become more crucial than ever. Particularly in industries where customer demand is constantly changing, the ability to accurately forecast is not just beneficial – it's essential. In this blog, I'll guide you through our demonstration on integrating PredictHQ's technology with PowerBI, illustrating how this synergy can significantly enhance forecasting models in various sectors. If demand forecasting has been a challenge for you, this blog will shed light on cutting-edge solutions to tackle these complexities.
Step-by-Step Enhancement Using PredictHQ and PowerBI
Demand forecasting is a critical component across multiple sectors, including retail, transportation, and hospitality. Traditional forecasting methods often fall short in accuracy due to the unpredictable nature of market trends and customer behavior. This is where the synergy between PredictHQ and PowerBI comes into play.
Tools we are using
Below is a quick list of tools and features we have used for this. If you want to follow along, you just need to sign up here and create a token here:
- PredictHQ
- Microsoft
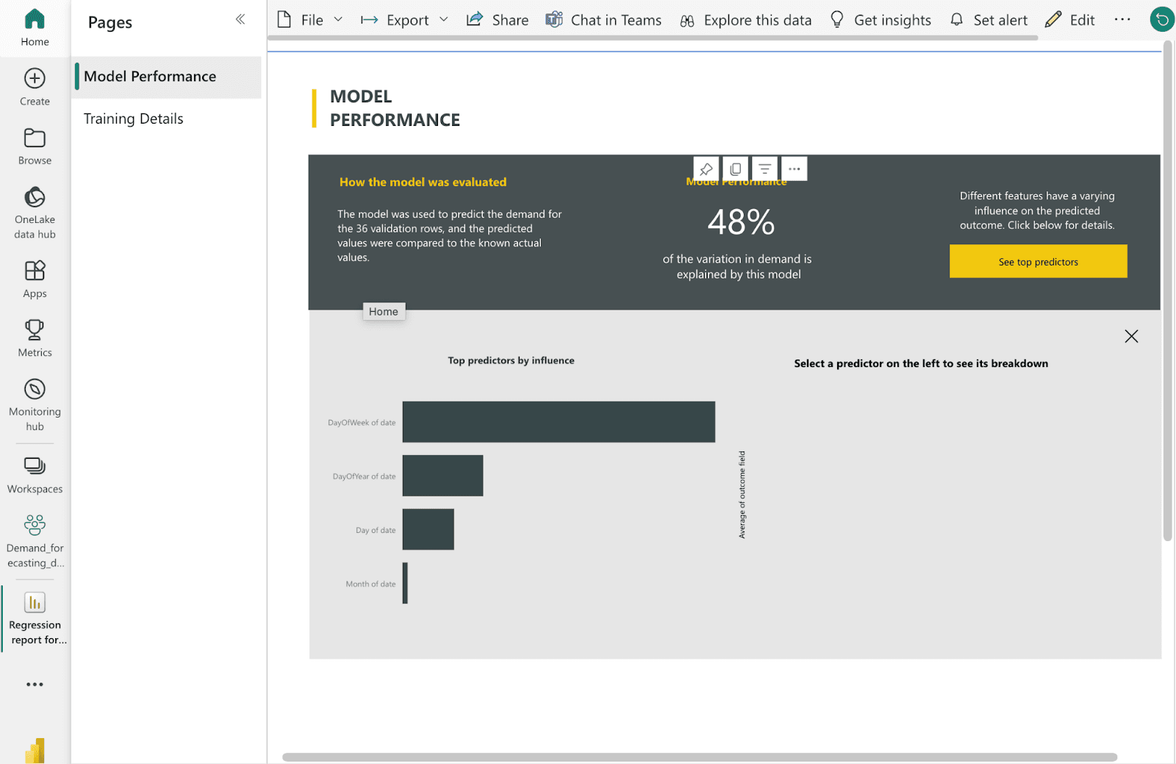
Starting Point: The Base Model in PowerBI
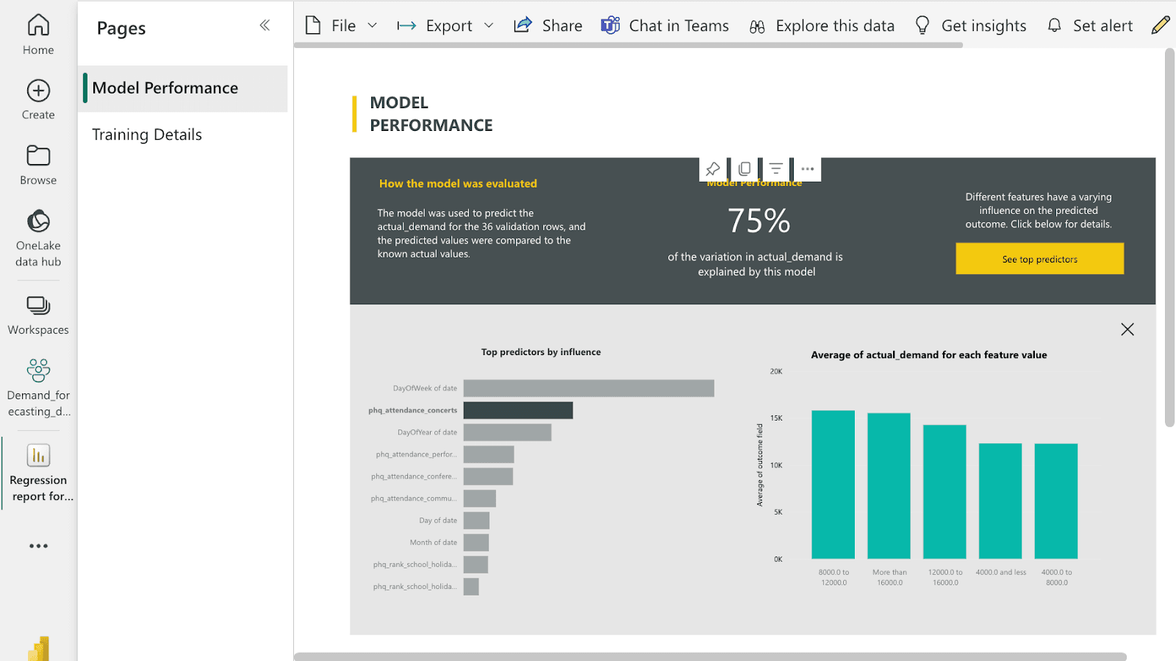
Our journey began with the PowerBI’s AutoML models. Using a combination of historical data and time trend features, we developed a base model in PowerBI. This initial version yielded a performance of 48%, a starting point for further enhancement.
Integration of PredictHQ Technology
I followed the PredictHQ tutorial titled 'Improving Demand Forecasting Models with Event Features'. This step is crucial for elevating our model's accuracy.
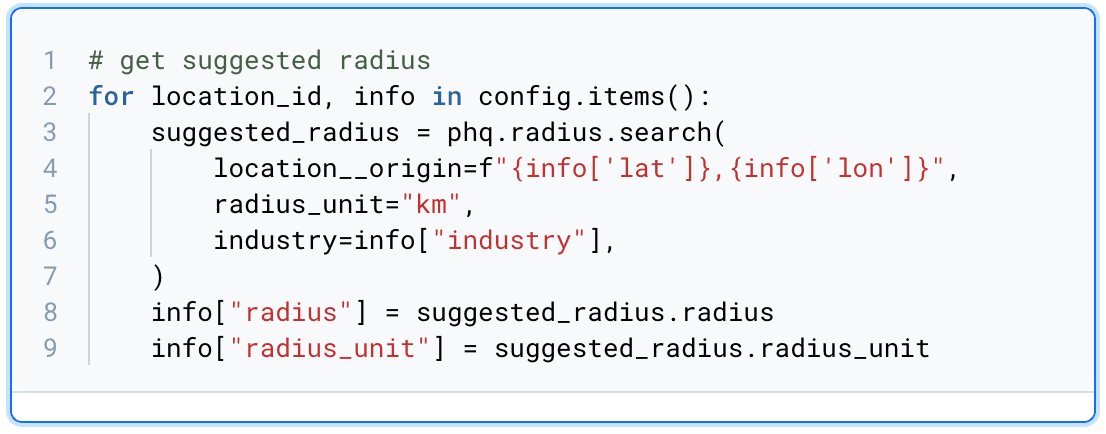
Suggested Radius API: Determine the optimal radius for event queries
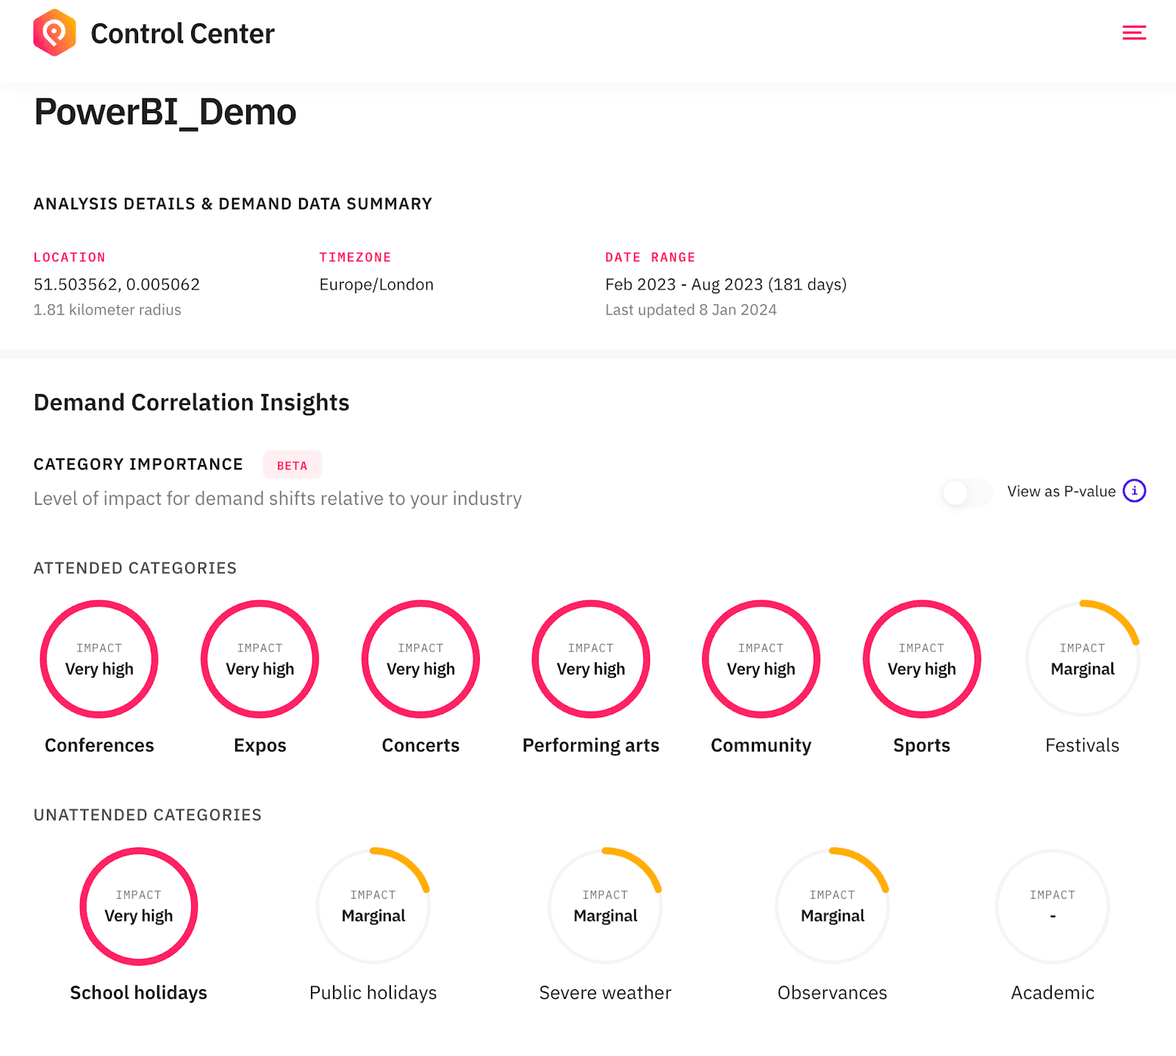
We began with PredictHQ's Suggested Radius API to filter event data pertinent to our specific location. This API determined an optimal 1.81-kilometer radius for our London restaurant, ensuring we focus on events most likely to affect our demand.
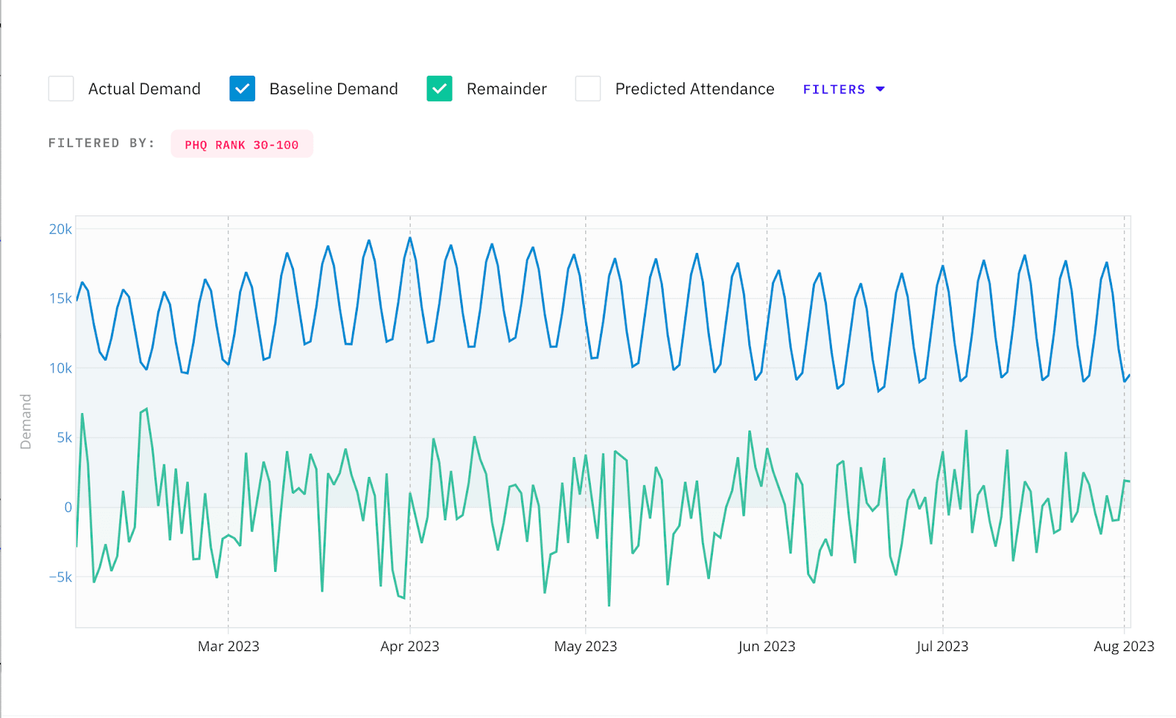
Beam API: Demand decomposition and anomaly detection
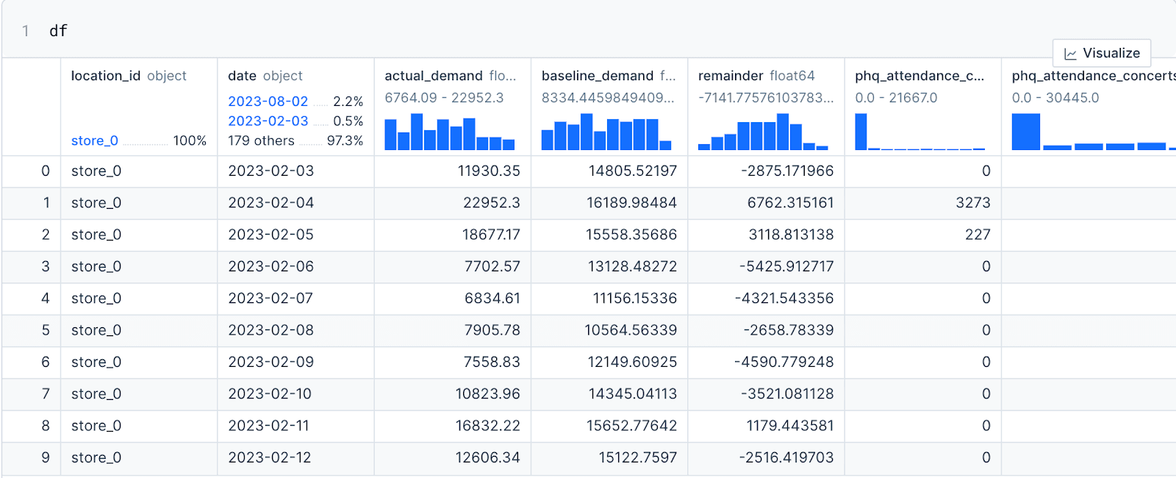
Next, the Beam API decomposes our demand data into baseline and remainders. This separation allowed us to distinguish regular demand from anomalies and understand the factors driving these demand anomalies, providing a foundation for a more targeted forecasting approach.
Feature Importance API: Identifying Key Events
We then utilized the Feature Importance API to evaluate the impact of various events on demand fluctuations. This API helped us identify which events significantly influenced demand, informing our model about the types of events to prioritize in our forecasting.
Feature API: Access prebuilt forecast-ready intelligence and features
Finally, using the insights from the Feature Importance API, we employed the Feature API to integrate detailed, relevant event features into our model. This precise merging of event features directly correlated with a notable improvement in our model's performance.
The Culmination: An Enhanced Forecasting Model
Upon integrating this data into PowerBI, we developed an advanced model that combined both historical data and PredictHQ's event data. The outcome was a significant leap in performance, reaching 75%.
Conclusion and Invitation for Feedback
This demonstration not only underlines the effectiveness of combining PredictHQ's technology with PowerBI but also opens up new avenues for accurate demand forecasting across various industries. I invite you to share your thoughts, experiences, or queries below, as we continue to explore and refine these cutting-edge tools in the realm of data analytics.
💡 Get in touch: Contact our team today Contact us