Get Started
Contact our data science experts to find out the best solutions for your business. We'll get back to you within 1 business day.
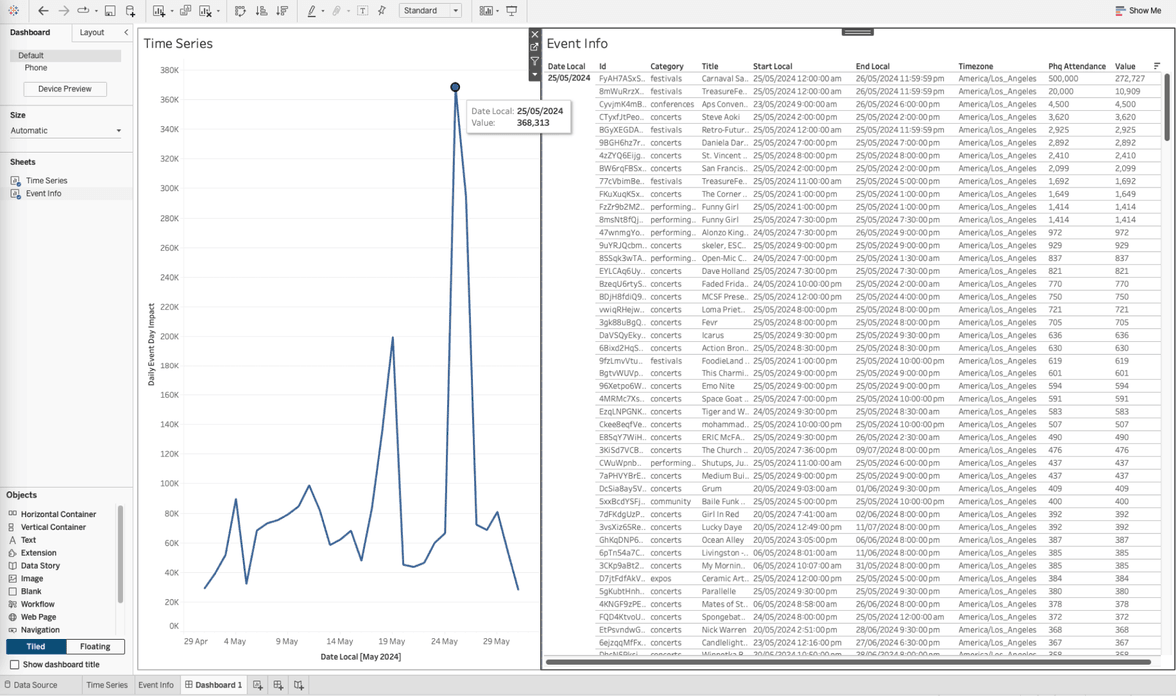
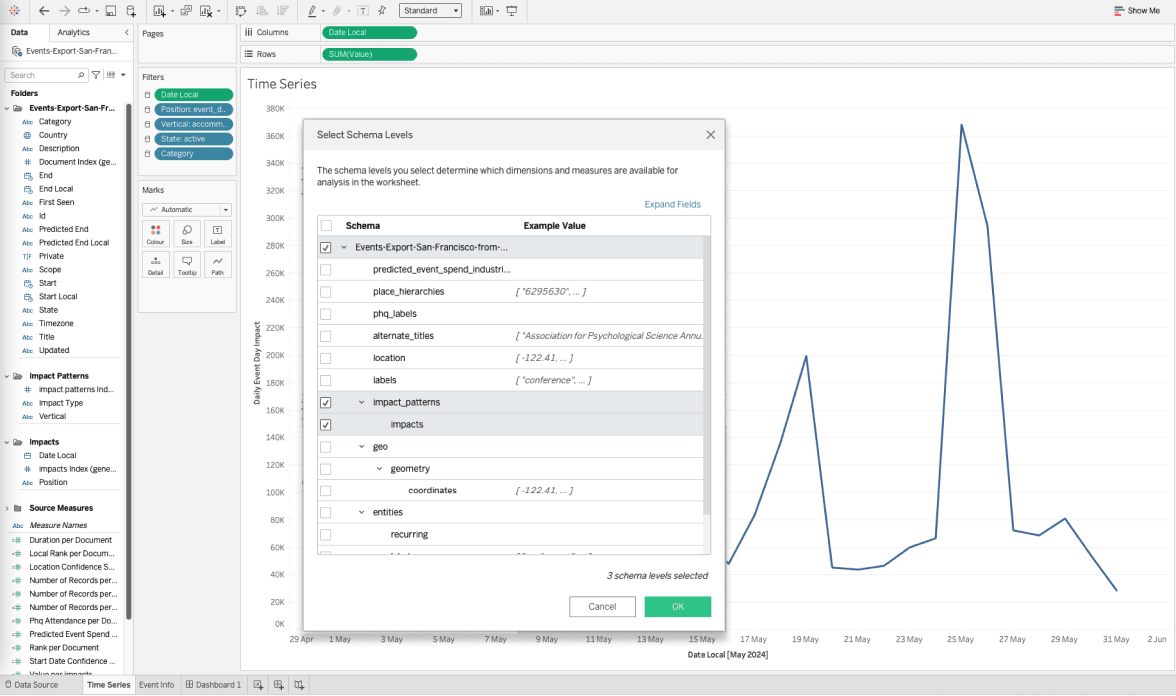
Quickly visualize and inform your teams of event-driven demand fluctuations, no matter where in the world they take place. Easily connect to and explore our intelligent, contextual event data in Tableau, with no code necessary.
Labor optimization: Ensuring the right number of drivers and store staff to meet demand.
Meeting the demands of customers and optimizing route delivery with anticipated disruptions.
Demand forecasting: Incorporating events into their Antuit-built models to better understand demand across 9600 stores.
Amazon Alexa's "Events Near Me" feature uses PredictHQ data to inform users about local events.
Demand forecasting: Getting drivers in the right place ahead of time to improve pick-up times.
Pricing: A key source of intelligence for the Lighthouse platform, enabling smarter pricing.

With PredictHQ the guesswork is gone, and we can clearly see where disruptions in delivery may arise, helping us deliver orders on time while cutting our manual research time by 50%.
Knowing the impact of demand causal factors like events will transform your business. The American Society of Hematology has a $45M estimated economic impact — and that's only one event in one city.
Contact our data science experts to find out the best solutions for your business. We'll get back to you within 1 business day.
Demand forecasting: Getting drivers in the right place ahead of time to improve pick-up times.
Labor optimization: Ensuring the right number of drivers and store staff to meet demand.
Amazon Alexa's "Events Near Me" feature uses PredictHQ data to inform users about local events.