Beam Value Quantification
An in-depth explanation of the terms used in Beam Value Quantification
Beam's Value Quantification module scans for anomalies in your uploaded demand data and leverages PredictHQ's comprehensive event data and coverage to confidently attribute a proportion of your demand fluctuations to demand shifts caused by events.
In order to gain the best results from Beam's Value Quantification module, please make sure to have specified your demand unit price, unit description and currency. This will not only ensure your results are accurate, but it will also make the page and any generated PDF reports more readable.


Your unit price can be the average, or blended costs of whichever type of unit they represent. For example, if the demand data represents food sales, you can set it as the average price of a meal at your establishment. If the demand data represents actual revenue, the unit price can remain at 1.
Explanation of terms
Overview
When viewing your Value Quantification results, you can expand the results to view more detailed information. The expanded section looks like this:
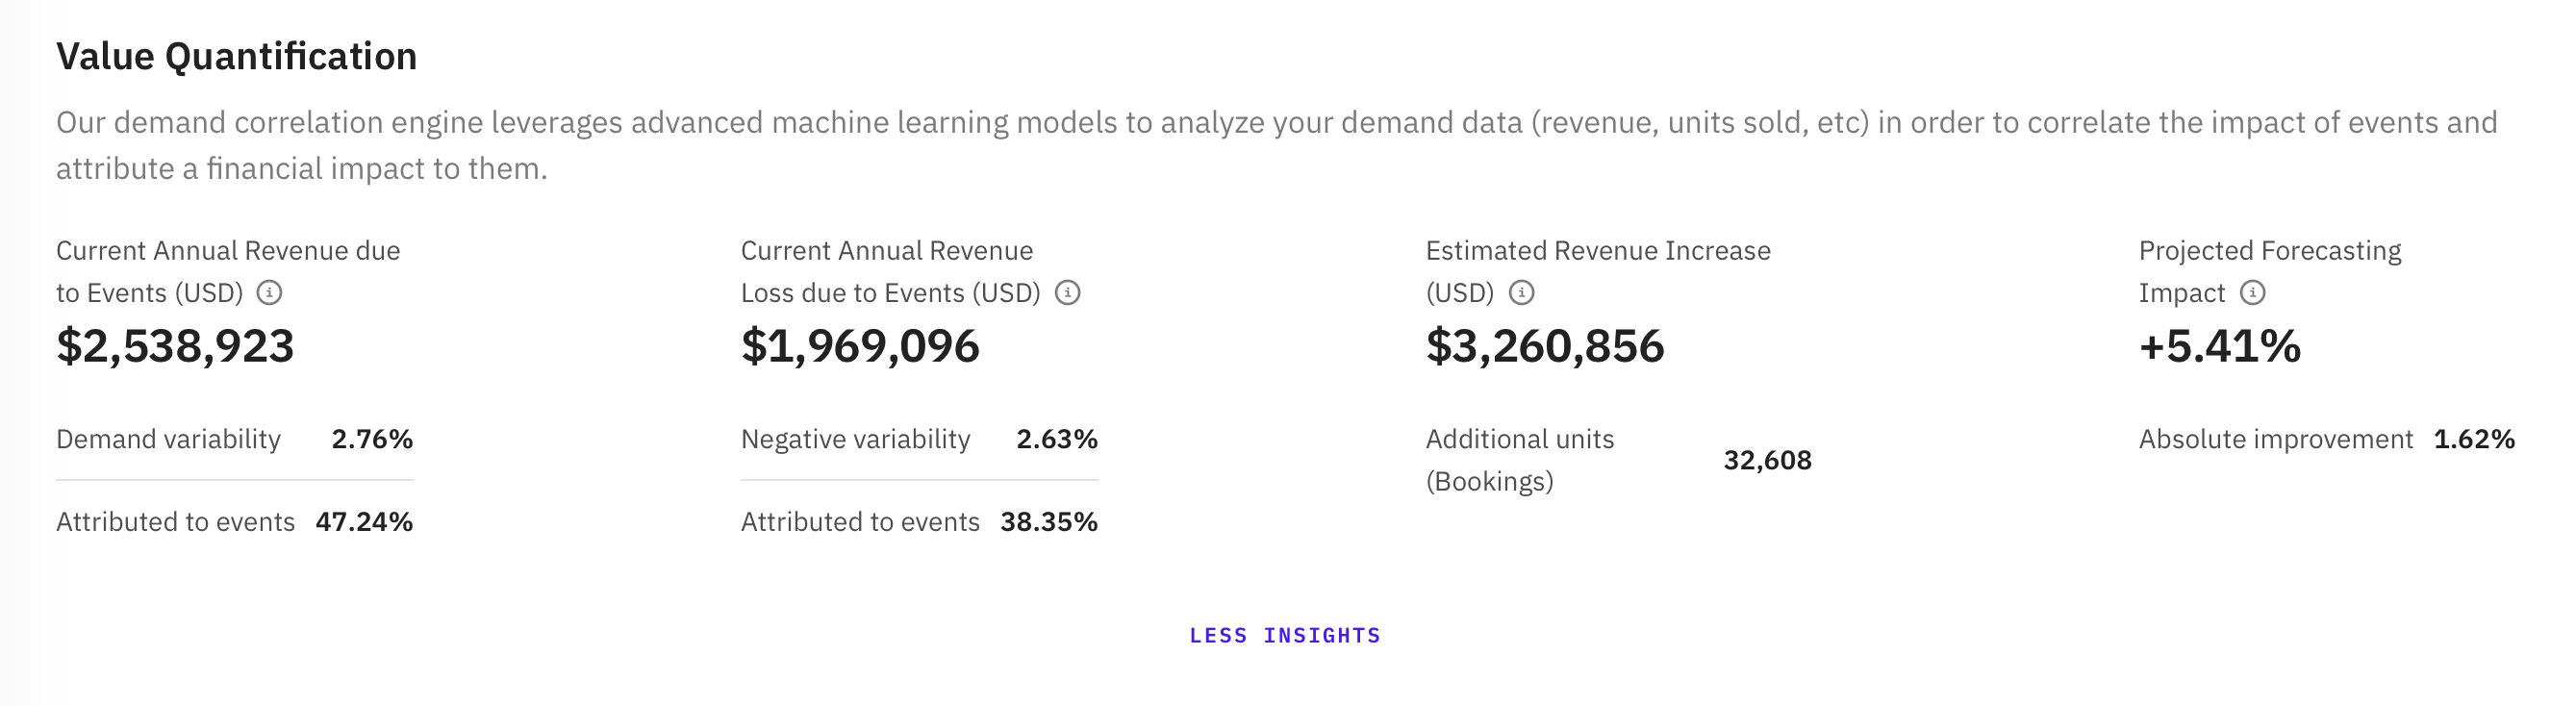
Current Annual Revenue due to Events
This represents the annual revenue that the Beam Value Quantification model has identified as attributable to events. The model looks at the proportion of positive variability (positive remainder) then leverages an attribution model to associate a percentage of the remainder to the impact of events taking place on a given day. Once those elements are worked out, it applies the unit you specified in order to calculate the annual revenue gain that is being caused by events.
Demand variability
Represents the positive variability, or positive remainder mentioned above. This is the anomalous shifts in demand that cannot be explained by overall growth trends nor seasonality.
Attributed to events
This figure represents the proportion of the overall positive variability that can be attributed to events.
Current Annual Revenue Loss due to Events
Similar to the annual revenue gain, this figure represents the annual revenue loss that the Beam Value Quantification model has identified as attributable to events.
Negative variability
Represents the negative variability, or negative remainder. This is the anomalous negative shifts in demand that cannot be explained by overall growth or decline trends nor seasonality.
Attributed to events
This figure represents the proportion of the overall negative variability that can be attributed to events.
Estimated Revenue Increase
This is the estimated revenue increase that could be gained through integrating PredictHQ data into your forecasts or operational decision-making. It is calculated based on the attributed historic impact of events (both positive and negative), an estimated error-reduction rate (see Projected Forecasting Impact) and the unit price.
Additional units
This represents the same uplift but in raw demand units. Whereas the Estimated Revenue Increase is in revenue format, this represents the uplift in demand units (e.g. Room Bookings) you could expect.
Projected Forecasting Impact
This represents the estimated forecasting and error-reduction improvements you could expect from integrating PredictHQ data into your forecasting models and decision-making. This percentage is measured in relative MAPE (Mean Absolute Percentage Error) improvements. It is based off the historical impact of events that has been observed on your demand patterns. The model assumes a 25% existing customer MAPE figure.